Unemployment benefits during COVID
Notes from two articles about unemployment insurance (UI) benefits during COVID-19 in the US. The two articles center around the fact that Congress paid an extra flat $600/week in UI benefits on top of state UI benefits. This results in workers receiving more in total UI benefits than their previous salary.
How frequent is this phenomenon? Does it discourage returning to work? Is there a better way?
TLDR
Ganon et al. explore differences in total UI benefits received across states and occupations, simulate wages and UI benefits, and propose and evaluate a different federal UI policy.
Altonji et al. use data provided by Homebase, a time clock software company, to regress the change in unemployment rate over time. They show that workers go back to work even when UI benefits are higher than their past salary.
Background
During COVID, the economy slowed down and unemployment reached record levels. So Congress passed the CARES Act, to boost UI by a flat $600 per week for 13 weeks.
Congress came up with this $600 amount so as to exactly match the average nation-wide salary when summed with the average UI provided by states.
Because it’s a flat number and based on an average, it results in 68% of eligible unemployed workers being paid more from unemployment benefits than their past salary.
In other words, their replacement rate (RR) is above 1.
This comes with several potential upsides: unemployed workers will be able to buy more goods, health insurance, and stay home and prevent the spread of COVID. However there are two potential drawbacks.
- “Unfairness”: Workers still employed in essential sectors make less than laid-off equivalent in non-essential sectors. For example, a janitor in a hospital vs in a shut-down office building.
- “Laziness”: Paying more discourages workers from returning to work.
Does data confirm these drawbacks?
Abbreviations
- UI: unemployment insurance. Money given to the unemployed weekly for a certain number of weeks. Higher salaries provide higher UI, up to a cap. UI policies vary by state.
- RR: replacement rate. A worker’s UI compared to their salary.
RR = UI / salary. - RRR: replacement rate ratio. A worker’s RR with the $600 of CARES vs without.
RRR = 1 + 600 / baseline UI.
“Laziness” vs going back to work
Method
The data comes from Homebase, a scheduling and time clock software for small businesses. It isn’t super representative. Half of its companies are in the food and drink industry, and all workers are hourly, not salaried. But those are particularly impacted by layoffs, and being paid more from unemployment. The sample is potentially biased, but definitely useful.
Moreover, summary statistics from the Homebase data in terms of hours worked, wages, and replacement rate, are all similar to those of the representative Current Population Survey (CPS) from the Census Bureau. So the Altonji findings may be representative.
Results
Altonji runs a linear regression, predicting probability of employment against the following covariates:
Week indicator. The baseline weeks are the 2 weeks of Jan 19 - Feb 1.Replacement ratio group: binned replacement rate ratio. Baseline is RRR below 250%, bins are 251-300%, 301-350%, etc.Week indicator * replacement ratio group: this is what we really are interested in. The null hypothesis is that laid-off workers are slower to return to work over time the higher their replacement ratio is. So we really only care about this coefficient. The other covariates are just controls.- Pre-CARES replacement rate
RR, Baseline wage,Industry indicator(education, food, retail, etc).
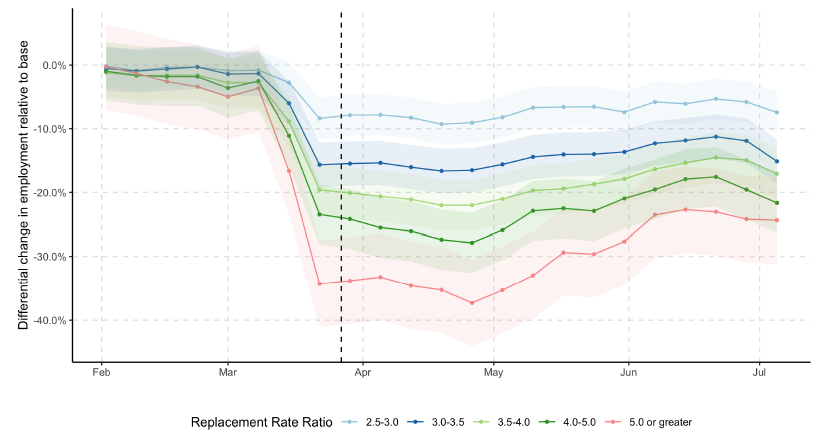
Plotting the coefficient for Week indicator * replacement ratio group, ie the probability of employment over time split by replacement ratio group, shows we can reject the null hypothesis.
After the shock of early March, employment goes back up for all groups equally.
Without establishing causality, this counter-intuitively suggests that workers paid proportionally more in CARES UI are more likely to go back to work.
The second more complex model adds COVID cases per capita in that state that week, and if the state had active policies that week for stay at home, mandatory closures of non-essential stores, restaurants, and gyms. The same results hold.
“Unfairness” exploration and alternative policy
There is a great deal of unfairness. Median replacement rates (RR) vary greatly across occupations and states.
- Among the top 10 occupations, the median replacement rate ranges from 65% for IT to 180% for food service.
- By state, it ranges from 129% in Maryland to 177% in New Mexico. New England states generally exhibit lower RR, while Southern states generally higher. This reflects local differences in minimum wage and state UI policies
Alternative policy
Topping up state UI by a fixed amount will always overcompensate a proportion of the unemployed: those who made less than that amount. For example, $300 per week, which is $10 more than the federal minimum wage of $7.25 per week for 40 hours, still leads to 42% of workers making more while unemployed.
Proposal: make the CARES amount a proportion of the past salary, instead of a fixed amount. Ganon simulates various proportions, and finds that 45% is the optimal proportion. It pays 68% of unemployed workers 80-100% of their past salary.
| Policy | <80% of past salary | 80-100% | >100% |
|---|---|---|---|
| Flat $600 | 20% | 12% | 68% |
| Flat $300 | 40% | 18% | 42% |
| 45% of past salary | 25% | 68% | 7% |